2017 APR SCORES: Data, Data, and more Data
Only 47.1 percent of Missouri students scored proficient or advanced on state math tests last school year.
That news was part of the Annual Performance Reports (APR) released by Missouri’s Department of Elementary and Secondary Education on Wednesday.
Students in the state fared better on English tests, with 61.4 percent scoring proficient or advanced, but the math scores are particularly troubling because truly understanding how the state rates schools comes close to requiring a Ph.D. in mathematics.
Data, Data, Data
A school, district or LEA’s APR score is the result of a variety of factors, including academic achievement, attendance, graduation rates, and college and career readiness, with each getting a point score based on how the school is performing as shown in the chart below.
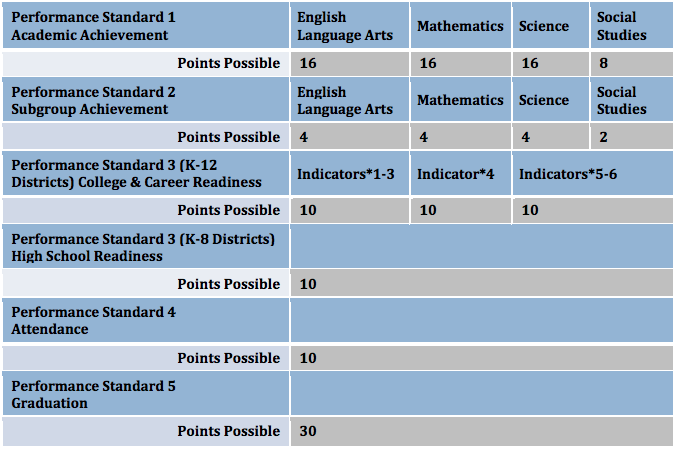
On the face of it, this process seems simple enough and seems to provide a good variety of indicators to represent the quality of a school. But when you look into the complex formulas that go into making the points for each category above, things get a little more complicated.
Take academic achievement for example. You would think that the total possible points would be representative of the school’s actual performance on state tests in the previous school year but, in reality, the final points awarded could come from three categories (status, progress or growth) none of which truly indicate how the school performed in the previous year.
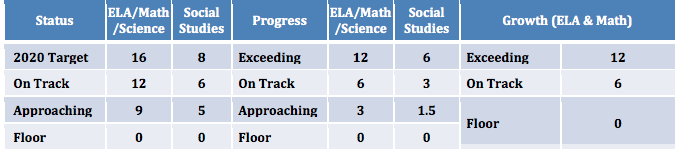
The status category comes the closest to representing actual performance, but even status is calculated based on a three-year (if available) average of the school’s scores on something called the MAP Performance Index (MPI) which is in itself a complex formula which awards schools more for underperforming students than for advanced or proficient students.
The “Progress” category (which also relies on MPI scores) is designed to assess a school’s ability to improve performance but is frequently used by underperforming districts, like the Normandy School Collaborative, as the sole basis for academic achievement points in APR calculation.
This category score is calculated in different ways for different subjects because the state keeps changing its tests. For science and social studies, it is calculated by averaging two years worth of data and setting targets based on an MPI gap. For ELA and Math, Years 1 and 2 are averaged, and Years 2 and 3 are averaged; the averages are then compared to determine the amount of improvement achieved.
Achieving the highest score for the “Progress” category only requires a five percent improvement.
The “Growth” category is designed to track individual student growth and is calculated through a very complex statistical analysis of score pairs (a score with a corresponding score from the previous year) and is only used to assess students in fourth through eighth grade.
According to DESE:
This relationship is used to calculate a “predicted outcome score” for each score pair. The differences between the predicted outcome scores and the observed outcome scores (the “residuals”) from all the analyzed score pairs are then analyzed to determine each LEA or school “effect” on student achievement growth… Current limitations in the assessment and related statistical analysis preclude developing a purely standards-based approach to evaluating the adequacy of student growth.
Confused yet?
Wading through what these scores actually mean is confusing and frustrating in a good year, but in a year like this one, when the state had some major testing issues, figuring it all out can be downright infuriating.
This is the second year in a row that the state has instituted a “hold harmless” approach to calculating the final APR scores. Last year the policy was needed because of changes in the state tests which made it difficult to compare scores from year to year. This year the policy is being used because of concerns over two high school-level tests (EOCs), Algebra 1 and English 2, which the state claims had errors and are again not comparable from year to year.
To resolve these issues, DESE used the highest scores from any year dating back to 2014 to calculate this score, a move which has likely saved a number of schools from significantly lower scores.
CEAM is here to help
Despite the questionable nature of the final scores as a result of the “hold harmless” policy this year, the CEAM Team will be providing a variety of analysis and easy to access scorecards for the St. Louis and Kansas City areas over the coming weeks.
In coming blogs, we will dial down a building-to-building comparison of how charter schools performed in 2017 compared to traditional district schools, look at how some of the state’s poorest performing school districts fared in this year’s APR, and provide easy to read letter-based scorecards for charter and district schools in both metro areas.
We are also eagerly awaiting the results of a Freedom of Information request for the actual EOC scores that were omitted from this year’s APR results and will be posting those scores as well as any other information obtained through the Freedom of Information request.
« Previous Post: Could Missouri’s ESA proposal be improved?
» Next Post: Metro districts get mixed APR results